
Your Cholesterol Is Fine. But Cholesterol Has a Hidden Problem.
Three draws, the same LDL of 78, and 3 different levels of risk underneath it.
Dr. Kevin Ham, MD
I just did my annual long bike ride, Tour de Victoria, on Vancouver Island. 140 km with 2000m of elevation. My typical time is ~4h 32m. This year I decided to go hard for about an hour or two. I stuck with the first and fastest peloton for 55 minutes and the second peloton for another 1.5 hours. Last year, my rear derailleur snapped as I was about to climb a hill and that ended my ride at 72 km. Time was 1:41. This year, at the same spot, my time was 1:44. Not bad but I was no longer racing against the clock. I was riding for cardiovascular health.
I’ve been pondering whether riding these distances was good, neutral or bad for my clogged arteries. What heart rate, what blood flow, what foods while eating during the ride, would be beneficial for me. I had a peeled orange, many dates and figs, and the typical glucose gels as we burn over 3000 kcalories on this ride alone at these efforts. Mt Everest is 8800m. We climb hills for a combined 2000m. This year it took me an hour longer as I stopped at four rest stops, my first time ever stopping at rest stops on gran fondos. I even did the 160 km version of this ride two years ago and didn’t take a single break and finished the ride in 5h 12m. I struggled in the last 30 km that time. This year, my riding time was 5h 11m but race time 5h 26m, an hour slower than my usual time.
My average heart rate just 138 bpm. I typically had 160s and 170s as averages previously going my best. My goal was to keep my heart rate under 170 on the steeper hills and mostly in the 140-150 range.
I’m also starting to wake up once to go empty my bladder, a sign of a large prostate. I am eating tomatoes daily for its lycopene. I also thought that sitting on the bike seat for 3-5 hours was hard on the prostate so I decided from October to February I am going to replace biking with swimming and jogging 3-5 km, about 6 min/km gets me 20m to 30m up and down a 1 km hill by my house. I’ve never ever been in my indoor pool since I moved into this home 16 years ago. Time to use it. I never did like swimming or running but because it gets rainy in Vancouver from Oct to March, this seemed like a great strategy to diversity my muscle workouts, get variety, and give my prostate relief from the small, hard bike seat for five months.
I also received my full lipid panel back from Quest labs and it had some remarkable results and some surprising ones that made me understand lipids and triglycerides better. I am trying to better understand the impact of triglycerides on my heart health and discerning what is truth as there are many ‘ideas of thought’ as to what is good for you. So let’s dive into my results and decipher them. I think you will find it educational to see why LDL can be deceiving as well as Triglycerides.
Oh, and my goal was to get to 135 lbs by this ride and I was close. 137/138, coming down from 146 last month with focus and discipline. Today I weighed in at 136.6 and I was so pleased. By my favourite ride, RBC Gran Fondo Whistler, a 122 km with 2000m elevation from Stanley Park to Whistler, I aim to be at 135 lbs. Last August, when my apoB was just 45, I was 133 lbs. My goal is to get back to this level where plaque reverses and try to stay there and improve upon it to low 40s or high 30s. I know it is possible because I did it once. I am very excited at the things I have insight into as a result of all of my ‘disappointing’ experiments over the past year that instead raised my LDL and apoB and didn’t have the fruit of yield I hoped for. This year, go for the 80/20 levers of plaque reversal and the flywheel compound effect.
Sometimes you have to fail to succeed, fail to learn and be humbled. I am very respectful of human biology and health and disease. I now have three to contend with: wet macular degeneration, a severe cause of blindness. I have had only one eye shot in almost four years and my eye doctor is very pleased. My clogged arteries and I did well with the 140 km ride. And now my enlarged prostate. I will help each with lifestyle medicine, as much as I can before I add drugs. I am looking for healing vs management, but also open to just arresting each of these and seeking reversal from each. So far so good, but it’s still early. I turn 56 next month …
Last week I put 15 months of my own blood work on the page and told you the uncomfortable part, that my apolipoprotein B had walked from 45 back to 73 while I told myself the bread was whole grain. This week I want to show you the other half of that story, and it is the half that matters more to you than to me, because it is the half that decides whether the number your doctor reads to you means anything at all. I am going to show you 3 days on which my LDL cholesterol was the same, and 3 completely different levels of risk underneath it.
Everything here comes off 3 Quest reports and 1 Access report. Same man, same fast, and for the 3 Quest draws the same laboratory running the same assay, so nothing you are about to see is an artefact of switching platforms.
The Same Number, Three Times
“The amount of cholesterol per low-density lipoprotein (LDL) particle is variable.”
Otvos JD, Mora S, Shalaurova I, Greenland P, Mackey RH, Goff DC Jr. Multi Ethnic Study of Atherosclerosis. Journal of Clinical Lipidology. 2011;5(2):105 to 113.
Here is the standard lipid panel from 23 September 2025, 30 June 2026 and 4 August 2026. This is the sheet almost every patient in the world is handed, and for most of them it is the only sheet they will ever see.
Table 1 The standard lipid panel across 3 draws
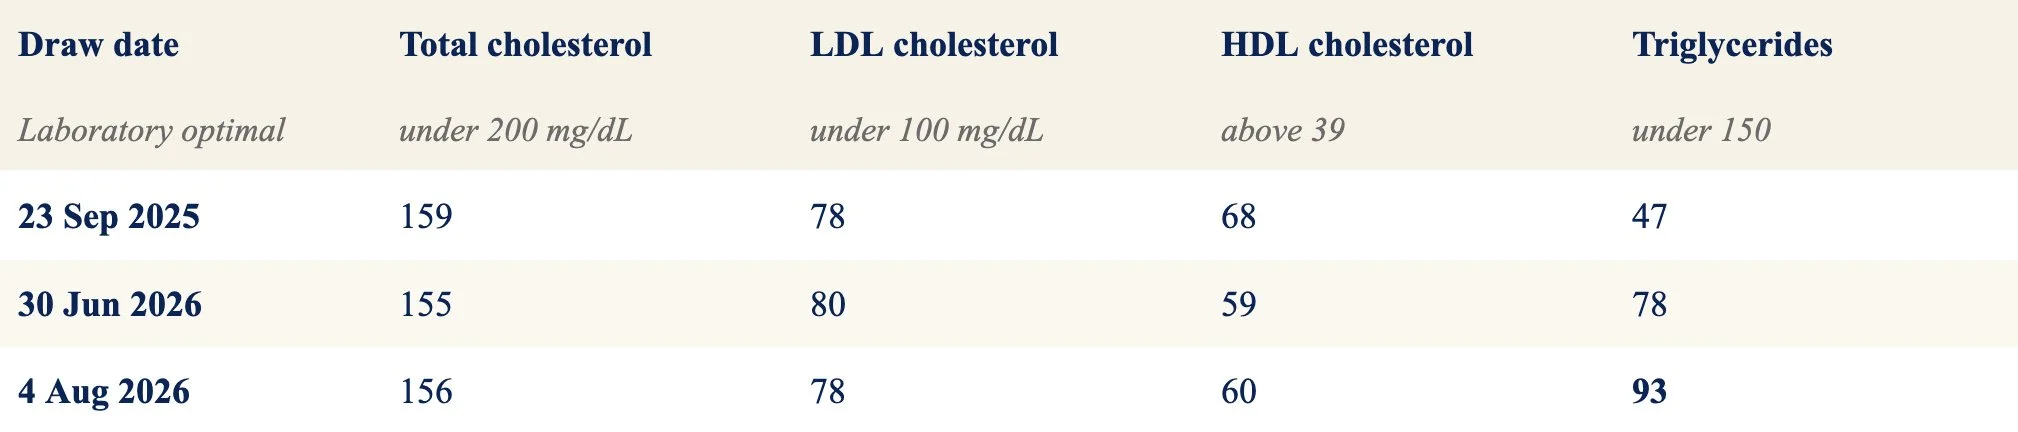
Nothing on this page is flagged. Not 1 value on any of the 3 days falls outside the laboratory reference range, which is precisely the problem.
Look at the LDL column. 78, then 80, then 78. Across 11 months that is a spread of 2 mg/dL, which sits inside the analytical noise of the test. Total cholesterol, 159, 155, 156. Also flat. Read in a busy clinic, these 3 panels are indistinguishable, and all 3 would be filed under well controlled without a second thought. If I told you that 1 of these 3 days carried 18 percent fewer of the particles that actually cause heart attacks, there is nothing on this table that would let you find it.
The Actual Count and the Cargo
“Apolipoprotein B unifies, amplifies, and simplifies the information from the conventional lipid markers.”
Sniderman AD, Thanassoulis G, Glavinovic T, Navar AM, Pencina M, Catapano A, Ference BA. JAMA Cardiology. 2019;4(12):1287 to 1295.
Now add the column the standard panel leaves out.
Table 2 The same 3 draws with apolipoprotein B
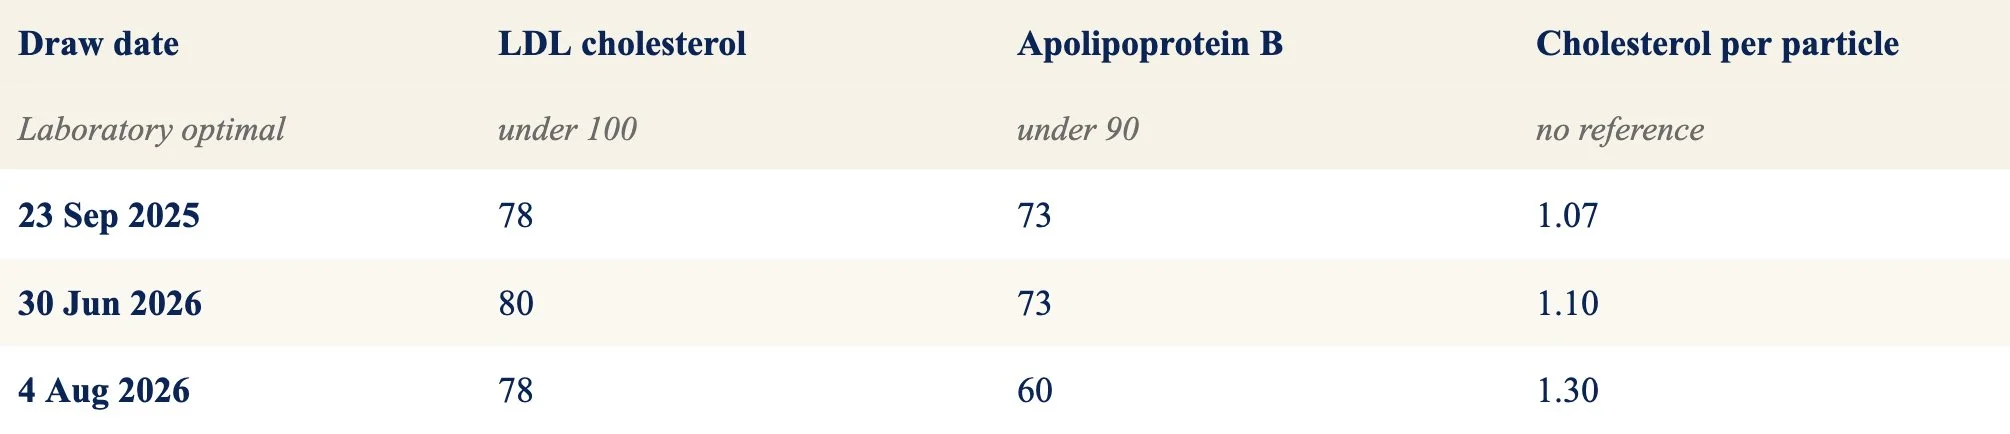
Cholesterol per particle is the LDL cholesterol divided by the apolipoprotein B. It is not a reported result and no laboratory prints it, which is exactly why almost nobody looks at it.
73, 73 and 60. Take the first row and the last row, 23 September 2025 and 4 August 2026. The LDL cholesterol is identical on both, 78 and 78, and the apolipoprotein B differs by 13. That is an 18% difference in the number of particles delivering that cholesterol into my artery wall on 2 days that the standard panel called the same.
Cholesterol is cargo. Apolipoprotein B is the count of the trucks. Atherosclerosis is not caused by cholesterol floating loose in the blood, it is caused by particles crossing the endothelium and being retained in the artery wall, and more particles means more retention, whatever each one happens to be carrying.
The last column is where the whole thing becomes visible. Divide the cholesterol by the particles and September gives 1.07 while August gives 1.30. Each particle in August was carrying about 21% more cholesterol than each particle in September. Same total cargo, fewer trucks, and a scale that measures only the cargo will report no change whatsoever.
What the Particle Count Said
“LDL-P was related more strongly to future CVD in both genders.”
Cromwell WC, Otvos JD, Keyes MJ, et al. Framingham Offspring Study. Journal of Clinical Lipidology. 2007;1(6):583 to 592.
Apolipoprotein B counts every atherogenic particle. The LDL particle number counts the LDL ones directly. Here is that column added to the same 3 days.
Table 3 The same 3 draws with the LDL particle number
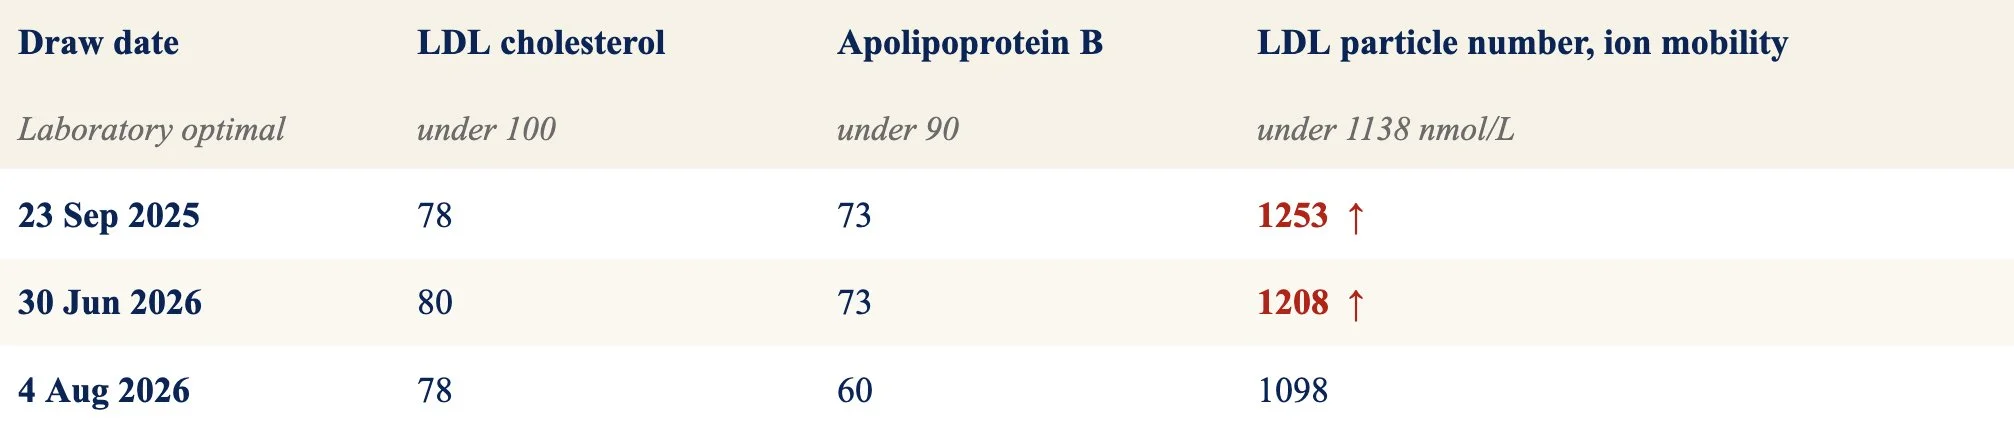
All 3 particle counts were run by ion mobility at the same laboratory, so these 3 numbers are directly comparable to each other.
Two of the 3 days came back flagged abnormal by the laboratory itself and the third did not, and my LDL cholesterol was the same on the first and the third. The particle count fell by 155 between September and August. The cholesterol fell by nothing. If a clinician had only the LDL, none of these 3 days would have started a conversation. Two of them should have.
The Shape of the Particles
“We cannot confirm that cholesterol-depleted LDL particles are substantially more atherogenic.”
Pencina KM, Pencina MJ, Lawler PR, et al. UK Biobank, Women’s Health Study and Framingham Heart Study. Clinical Chemistry. 2023;69(1):48 to 55.
The last layer explains every layer above it. Particles are not all the same size, and the small ones carry less cholesterol each.
Table 4 Subfractions and particle size across the same 3 draws
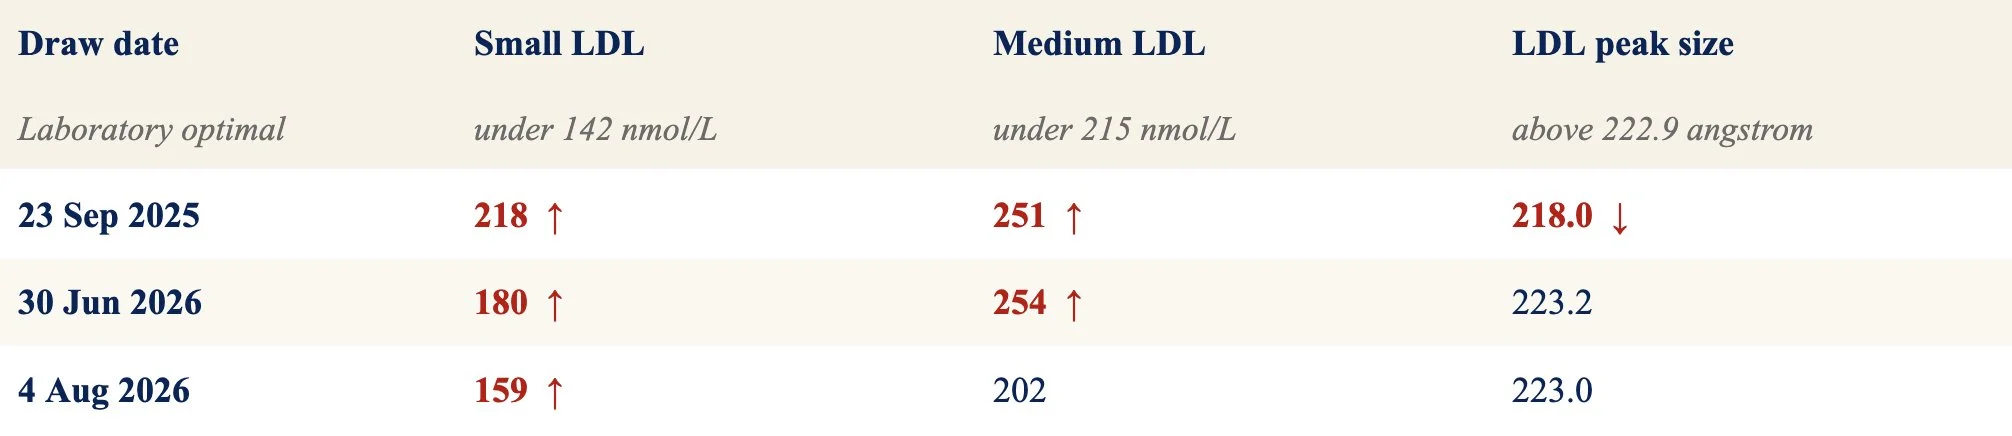
The peak size flag on 23 September 2025 points down, not up. It is the only low flag in the series and it sits on the row with an LDL cholesterol of 78.
Small LDL, optimal under 142, reads 218, then 180, then 159. Still flagged high on all 3 days, and I am not going to pretend otherwise, but falling by 27% across the series.
Medium LDL, optimal under 215, reads 251, 254, and then 202, which crosses into range on the last draw.
And the peak particle size, optimal above 222.9 angstroms, reads 218.0 in September, flagged low, then 223.2 and 223.0 in 2026, in range.
I put that quote at the head of this section on purpose, because it cuts against me. The largest analysis of the question, across more than 337,000 people and roughly 15,000 coronary events, could not confirm that cholesterol depleted particles are substantially more atherogenic than cholesterol replete ones. Particle size is a signal about my metabolism. Particle number is the thing doing the damage. Read this section as evidence that my particles changed, not as proof that the change in shape is what mattered.
On 23 September 2025 my particles were flagged small. On 4 August 2026 they were not. My LDL cholesterol was 78 on both of those days. That is the mechanism in a single sentence. Smaller particles carry less cholesterol each, so it takes more of them to carry the same load, and if your particles shrink your count climbs while your LDL sits perfectly still.
The Second Tube
“Direct detection and quantitation of the number of LDL particles”
Quest Diagnostics Clinical Education Center. Cardio IQ Lipoprotein Fractionation, Ion Mobility. Methodology note 134, describing ion mobility. Printed as a link on my own reports.
On the morning of August 4, 2026 I did not give 1 tube of blood. I gave 2. Same arm, same fast, minutes apart. One went to Quest, which counts particles by ion mobility. The other went to Access, which counts them by nuclear magnetic resonance.
Table 5 One morning, one arm, two laboratories

The optimal columns are the laboratories own, printed on their own reports.
Start with the apolipoprotein B. 60 at 1 laboratory and 59 at the other. One mg/dL apart, on 2 different machines. That is about as close as 2 independent laboratories ever come to each other on anything.
Now read the line underneath it. 1098 and 530. Not 10 percent apart, not 20 percent apart. More than double. And on the Access scale that 530 is comfortably optimal and my small particles came back under 90, which is the best subfraction result I have ever seen on a page with my name on it. On the Quest scale my count is 1098, just inside optimal, and my small LDL is still red at 159.
Then read across the 2 optimal columns, because this is the part that should stop you. One laboratory calls small LDL abnormal above 142. The other calls it abnormal above 527. Same measurement, same name, and the line between normal and abnormal moved by almost 4 times when the letterhead changed.
So Which Method Is Correct
“These and other results highlight the lack of rigorous standardization.”
Feingold KR. Utility of Advanced Lipoprotein Testing in Clinical Practice. Endotext, on the measurement of LDL and HDL particle number by different methods.
This is the question I get asked more than any other, and the honest answer comes in 3 parts of which only the first is comfortable.
1. Neither one is a reference standard. There is no international calibrator for LDL particle number the way there is for cholesterol. Both are laboratory developed tests, each calibrated against its own reference population, which is exactly why the 2 reports print different cutoffs.
2. You can still audit them, and here is how. Apolipoprotein B is the arbiter, because every one of these particles carries exactly 1 apolipoprotein B molecule and that gives you an exchange rate of roughly 19 nanomoles of particles for every 1 milligram per decilitre. An apolipoprotein B of 60 puts me near 1,150 atherogenic particles per litre in total. Subtract my lipoprotein(a) at 38 nanomoles per litre, subtract the very low density and intermediate density particles, and roughly 1,000 to 1,050 of them should be LDL.
Ion mobility said 1098. Nuclear magnetic resonance said 530. The nuclear magnetic resonance result leaves about half of my apolipoprotein B unaccounted for, and those particles have to be somewhere. There is a second reason to doubt it. By the laboratories own published descriptions, the nuclear magnetic resonance particle number counts the 3 LDL subclasses plus the intermediate density particles, while ion mobility counts the LDL particles directly. If anything it should have read higher than the ion mobility number. It read less than half.
So on that morning, the ion mobility number was the one that added up.
3, and do not skip it, because it is the part that keeps me honest. Do not walk away thinking ion mobility wins. On 18 November 2025 and again on 27 February 2026 my apolipoprotein B was 66 and then 67, which is the same number twice, and my ion mobility particle count was 802 and then 1342. That is a 67 percent swing with nothing underneath it to explain it, and 1342 sits above what an apolipoprotein B of 67 can physically account for. Both technologies have days when they wobble. I have now caught both of them doing it in my own chart.
And this is not a quirk of 1 man. When blood from 228 apparently healthy adults was sent to 4 different reference laboratories running 4 different technologies, all 4 agreed completely on something as simple as whether the person was pattern A or pattern B in 64 percent of cases. The best agreeing pair of methods reached 98 percent. The rest did not.
The Rule I Now Run My Chart On
“The achieved reduction in LDL-C is concordant with the reduction in LDL particle number.”
Ference BA, Ginsberg HN, Graham I, et al. European Atherosclerosis Society Consensus Panel. European Heart Journal. 2017;38(32):2459 to 2472. The condition attached to the benefit of lowering LDL-C.
Anchor on apolipoprotein B, because it is the number that survived being measured twice on the same morning by 2 laboratories that agree on nothing else. Use the particle count for context, from 1 laboratory, on 1 method, read serially over time. Never compare a particle count from one laboratory against a particle count from another and call the difference progress.
Never let a single particle count, good or bad, change the plan on its own. And when a result surprises you, repeat it before you believe it. That applies to the flattering ones with more force than the frightening ones, because a frightening result gets repeated automatically and a flattering one gets framed.
I am holding myself to that this month. My non HDL cholesterol was 96 on June 30 and 96 on August 4, identical, and yet my apolipoprotein B fell from 73 to 60 across those same 5 weeks. A particle count falling that far while the cholesterol those particles carry does not move at all is unusual, and the honest response to unusual is not celebration. It is another tube. So the apolipoprotein B is being repeated, and I will publish whatever comes back in September and October.
What To Ask For
“The evidence has continued to mount in favor of apoB.”
Glavinovic T, Thanassoulis G, de Graaf J, Couture P, Hegele RA, Sniderman AD. Journal of the American Heart Association. 2022;11(20):e025858.
Ask for apolipoprotein B by name. It is inexpensive, it does not require fasting, and it is the most reproducible number in this entire newsletter. If your clinician has not ordered it before, the sentence that works is that you want a particle based measure because your cholesterol and your particle count may be discordant.
Ask for the particle number and the particle size, and then ask 1 more question that almost nobody asks. Which method. Write the answer down, ion mobility or nuclear magnetic resonance, and stay on it.
And get the actual report, not the summary and not the portal traffic light. The report, with the reference ranges printed beside the values. Everything in this issue was sitting in plain sight on pages that most people never open.
LDL cholesterol is not a useless number. It is an incomplete one. It tells you how much cholesterol is riding in your blood and nothing about how many vehicles are carrying it or how big they are, and those are the 2 things that decide whether it ends up in your artery wall. If your LDL is the only number you have, you do not yet know your risk. You know your cargo.
A Request
Each Saturday, I upload a new Youtube video. Please like, comment and subscribe so I can help many others in your network and beyond, it’s my mission to help people avoid the same fate as Rob, the same fate as I could have had. Heart attack, stroke or sudden death.
https://www.youtube.com/@DrKevinHam
I write two insightful newsletters a month on Fridays, and post one video on my Youtube Channel every Saturday. I find it is a great cadence for myself. How is this cadence for you?
What to Start Now
Establish a cadence for Tracking, which is the “T” in my CAST model, to heal yourself (Cut, Add, Strengthen, Track)
Get your apoB at least on top of your LDL, HDL and Triglycerides.
Understand your results by referring to this article.
See my Youtube videos on lowering your LDL by CAST ~ 50-70% in just 12 weeks.
Your Question
A question worth exercising with
For yourself. For someone you love. Answer this question in the quietness of your day.
What will you change in your lifestyle today and when will you get your apoB?
For Someone You Love
There is someone in your life running and falling. You thought of them. Send this to them. Your loved ones just need the information to act and a guide to help them.
Keep going. The race is long, the road is beautiful, and the body was built to heal. Grace, strength and love to you in all your heart’s desires.
MORE READINGS YOU’LL ENJOY
Health
Reversing My 77% Heart Plaques
Stats Say You Likely Have Heart Plaque
The Healing Power of Food: Nitric Oxide
Meaning
I pray you unlock your heart to reach the height of your full potential by discovering your calling.
Kevin Ham, MD
Appendix:
Sources
Otvos JD, Mora S, Shalaurova I, Greenland P, Mackey RH, Goff DC Jr. Clinical implications of discordance between low density lipoprotein cholesterol and particle number. Journal of Clinical Lipidology. 2011;5(2):105 to 113.
The Multi Ethnic Study of Atherosclerosis, 6,814 people free of cardiovascular disease at entry with 319 events over 5.5 years. LDL cholesterol and LDL particle number correlated at 0.75 but were often discordant, and among the discordant participants only the particle number was associated with incident events. The paper also states the mechanism used throughout this issue, that cholesterol carried per particle varies with particle size.
Sniderman AD, Thanassoulis G, Glavinovic T, et al. Apolipoprotein B particles and cardiovascular disease: a narrative review. JAMA Cardiology. 2019;4(12):1287 to 1295.
Review of why a particle count outperforms a cholesterol concentration. Each atherogenic particle carries exactly 1 apolipoprotein B molecule, making apolipoprotein B a direct particle count, and when it disagrees with LDL cholesterol the apolipoprotein B is the better measure of risk.
Cromwell WC, Otvos JD, Keyes MJ, et al. LDL particle number and risk of future cardiovascular disease in the Framingham Offspring Study. Journal of Clinical Lipidology. 2007;1(6):583 to 592.
An independent prospective cohort reaching the same conclusion as the Multi Ethnic Study of Atherosclerosis. Where the cholesterol measure and the particle measure of LDL disagree, events follow the particle measure.
Sninsky JJ, Rowland CM, Baca AM, Caulfield MP, Superko HR. Classification of LDL phenotypes by 4 methods of determining lipoprotein particle size. Journal of Investigative Medicine. 2013;61(6):942 to 949.
Blood from 228 apparently healthy adults sent to 4 clinical reference laboratories running segmented gradient gel electrophoresis, vertical auto profile ultracentrifugation, nuclear magnetic resonance and ion mobility. All 4 agreed completely on the reported phenotype, pattern A or pattern B, in 64 percent of subjects. The best agreeing pair reached 98 percent.
Pencina KM, Pencina MJ, Lawler PR, Engert JC, Dufresne L, Ridker PM, Thanassoulis G, Mora S, Sniderman AD. Interplay of atherogenic particle number and particle size and the risk of coronary heart disease. Clinical Chemistry. 2023;69(1):48 to 55.
Participants without cardiovascular disease from the UK Biobank, the Women’s Health Study and the Framingham Heart Study, 337,225 people with 14,994 coronary events, examining apolipoprotein B together with particle size approximated by the LDL cholesterol to apolipoprotein B ratio. Given a null association in 2 of the 3 cohorts the authors could not confirm that cholesterol depleted particles are substantially more atherogenic, and concluded that the results support routine measurement of apolipoprotein B in clinical care.
Glavinovic T, Thanassoulis G, de Graaf J, Couture P, Hegele RA, Sniderman AD. Physiological bases for the superiority of apolipoprotein B over low density lipoprotein cholesterol and non high density lipoprotein cholesterol as a marker of cardiovascular risk. Journal of the American Heart Association. 2022;11(20):e025858.
Review of the physiological mechanisms behind the superiority of apolipoprotein B, written after the 2019 European guidelines named it a more accurate marker of risk than LDL cholesterol and non HDL cholesterol.
Caulfield MP, Li S, Lee G, et al. Direct determination of lipoprotein particle sizes and concentrations by ion mobility analysis. Clinical Chemistry. 2008;54(8):1307 to 1316.
The original description of the ion mobility method behind the Quest particle counts in Tables 3, 4 and 5.
Quest Diagnostics Clinical Education Center. Cardio IQ Lipoprotein Fractionation, Ion Mobility. Frequently asked question 134.
The methodology note printed as a link on my own reports. It states that ion mobility directly detects and quantitates the number of LDL particles while the nuclear magnetic resonance particle number includes the 3 LDL subclasses plus intermediate density lipoprotein and is derived indirectly. The basis for the argument that the nuclear magnetic resonance count should not read lower than the ion mobility count.
Feingold KR. Utility of advanced lipoprotein testing in clinical practice. Endotext.
Review chapter documenting discrepant particle number results between methods and the resulting lack of rigorous standardisation, and noting that routine advanced lipoprotein testing is not currently recommended by the American College of Cardiology and American Heart Association guidelines.
Ference BA, Ginsberg HN, Graham I, et al. Low density lipoproteins cause atherosclerotic cardiovascular disease. European Heart Journal. 2017;38(32):2459 to 2472.
European Atherosclerosis Society consensus statement establishing causality rather than association, and establishing that the effect depends on both the magnitude of exposure and its cumulative duration. The reason a particle count you have measured correctly and held low for years is worth more than a good number you measured once.
Personal laboratory records. Quest Diagnostics, specimens collected 23 September 2025, 30 June 2026 and 4 August 2026, and Access Medical Laboratories, specimen collected 4 August 2026.
All values in Tables 1 through 5. The 3 Quest draws were run with lipoprotein fractionation by ion mobility on each occasion. The Access specimen was drawn on the same morning as the Quest specimen of 4 August and run by nuclear magnetic resonance.
This issue describes my own laboratory results and is written for education. It is not medical advice and it is not a substitute for care from your own physician.
Subscribe to my Compounding Wisdom newsletter and start transforming your life. ham.com
Subscribe to my YouTube channel @DrKevinHamfor videos on how I reversed my clogged arteries in 3 months, the top foods that clear your arteries, and the first principles of health that can save your life. Like, share and subscribe — it could save the life of someone you love.
